Dutch Drought
Interactive Figma prototype of an informational one pager about lower groundwater-levels in the Netherlands.
View Figma prototype ↗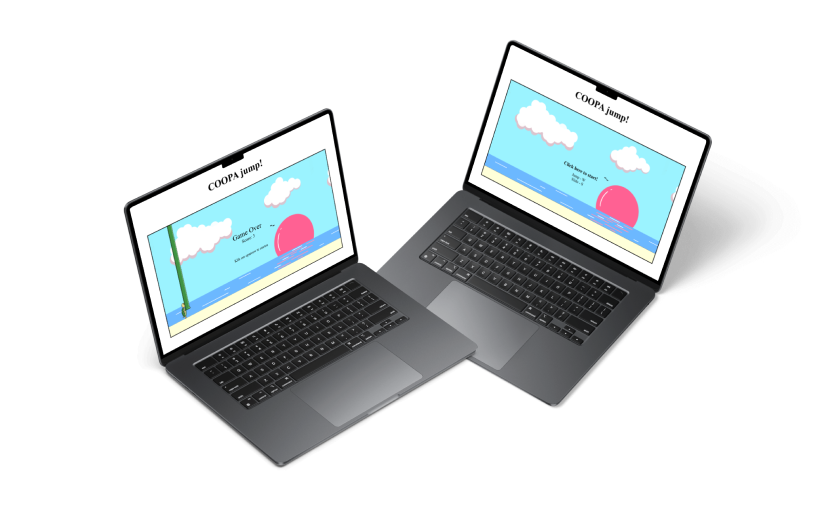
About
Assignment
Design an interactive data visualisation for Clever Franke, an award-winning information design studio, that explores whether climate change has altered Dutch weather patterns and how this affects the way people in the Netherlands experience the weather.
Solution
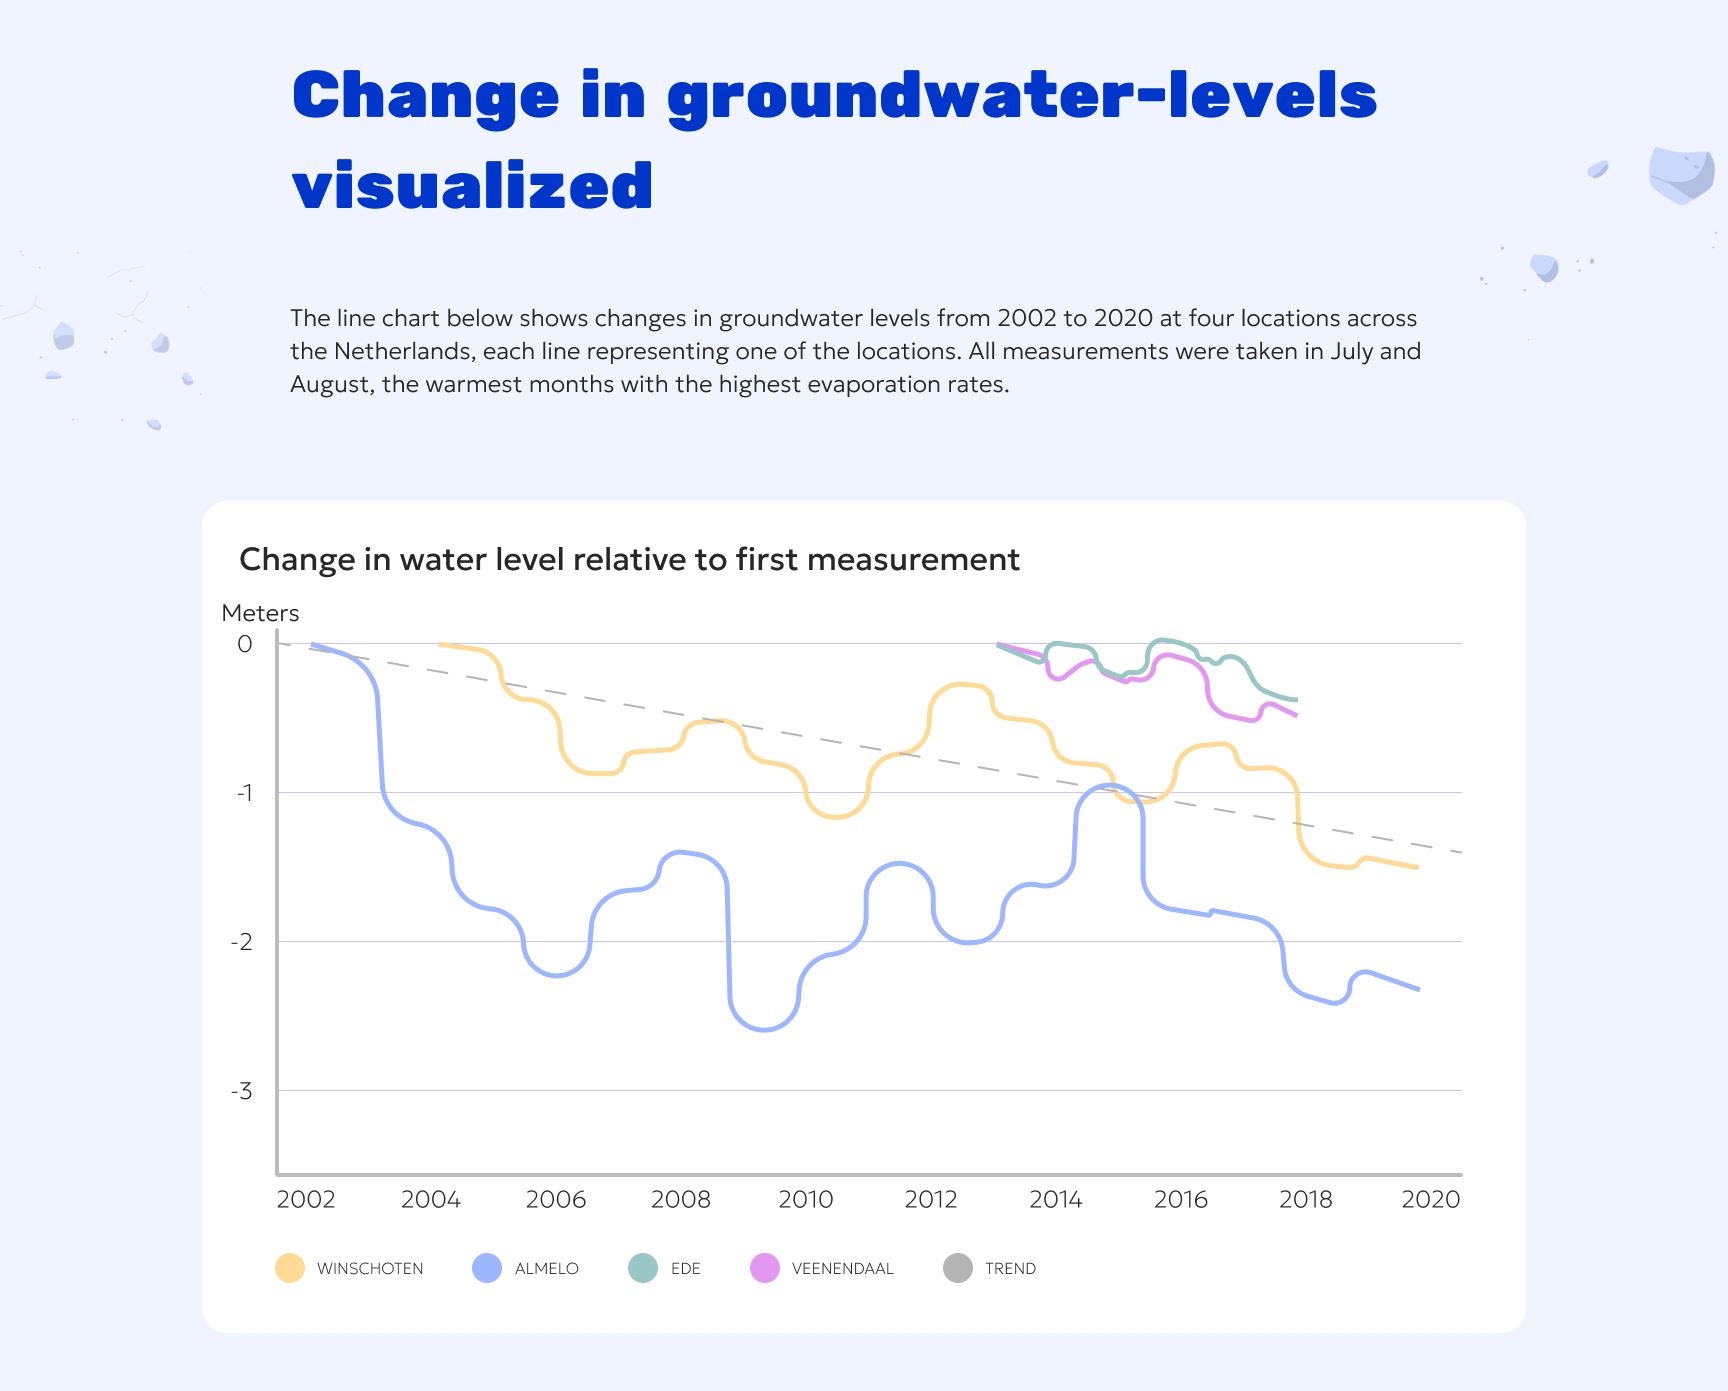
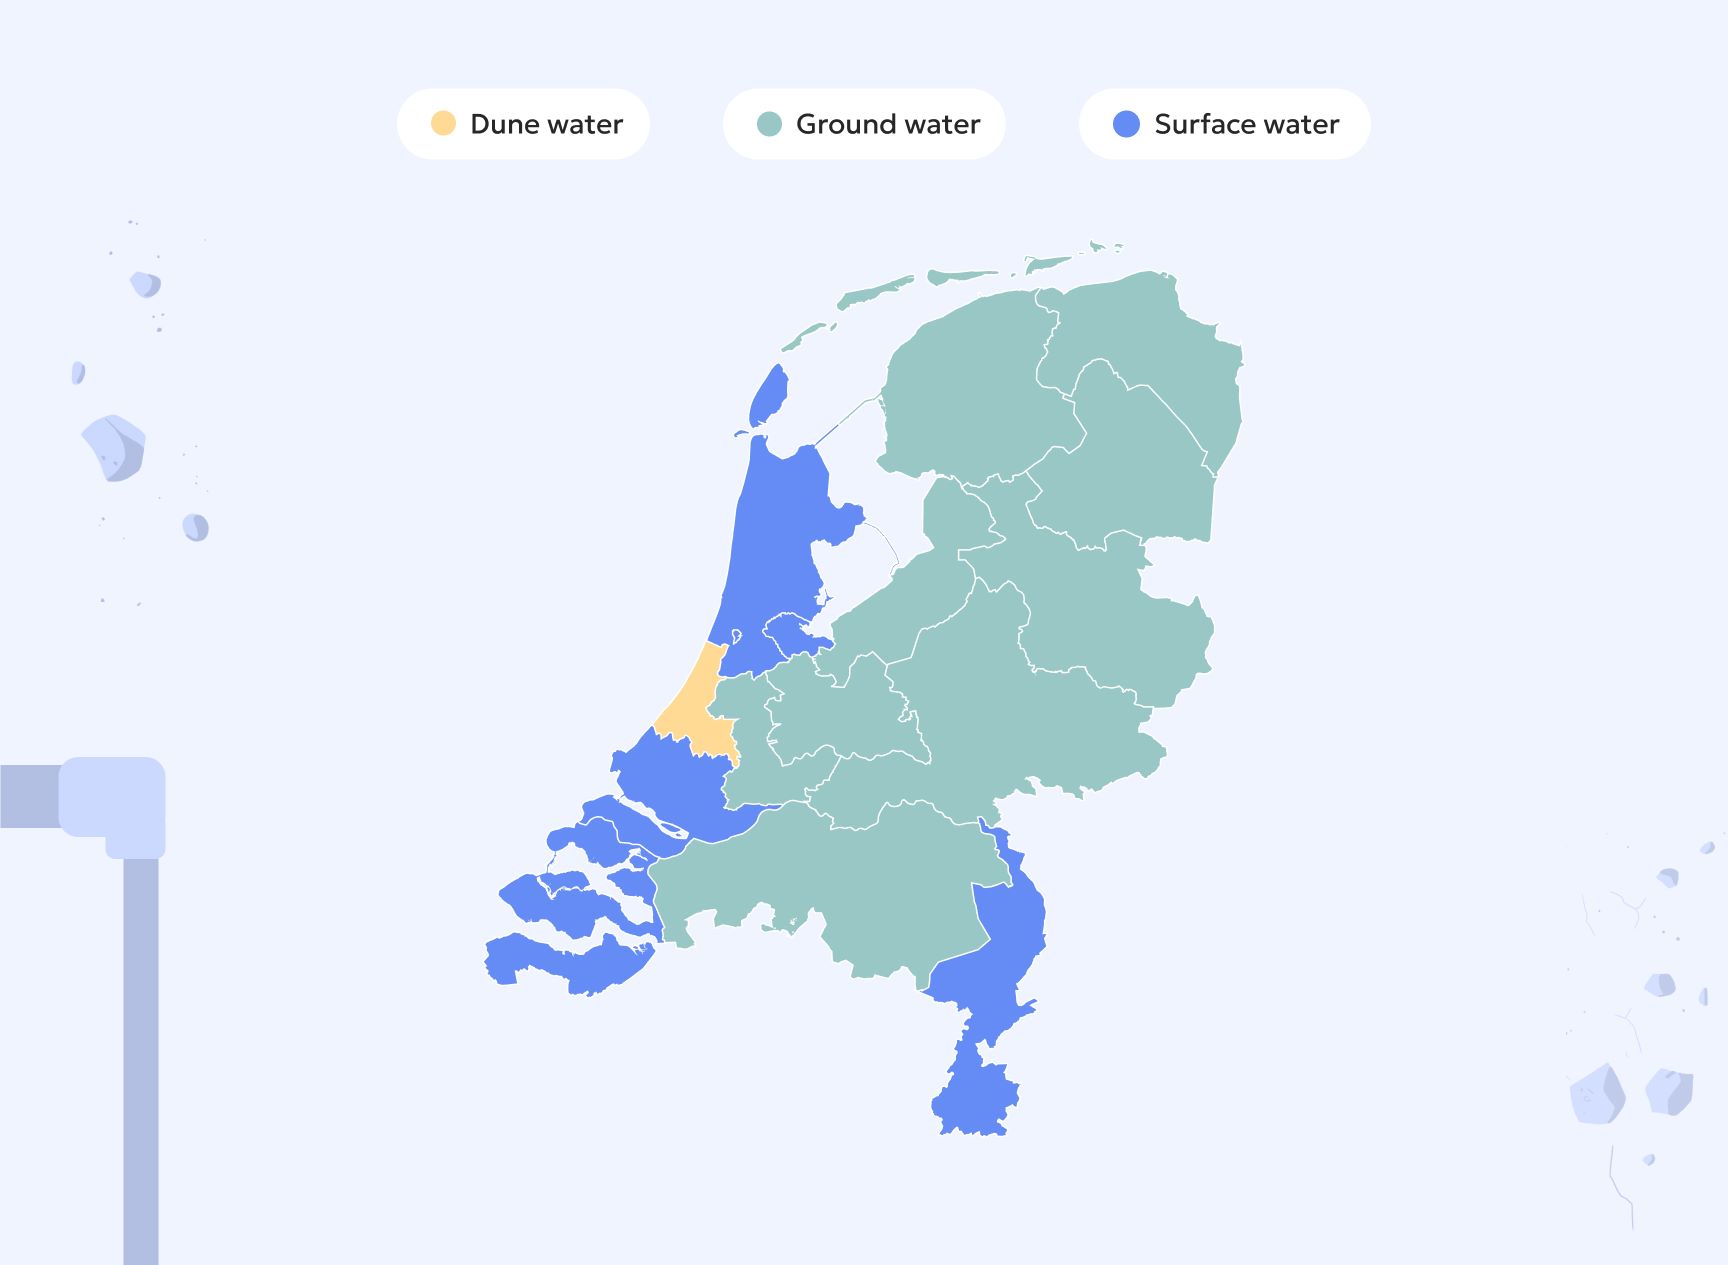
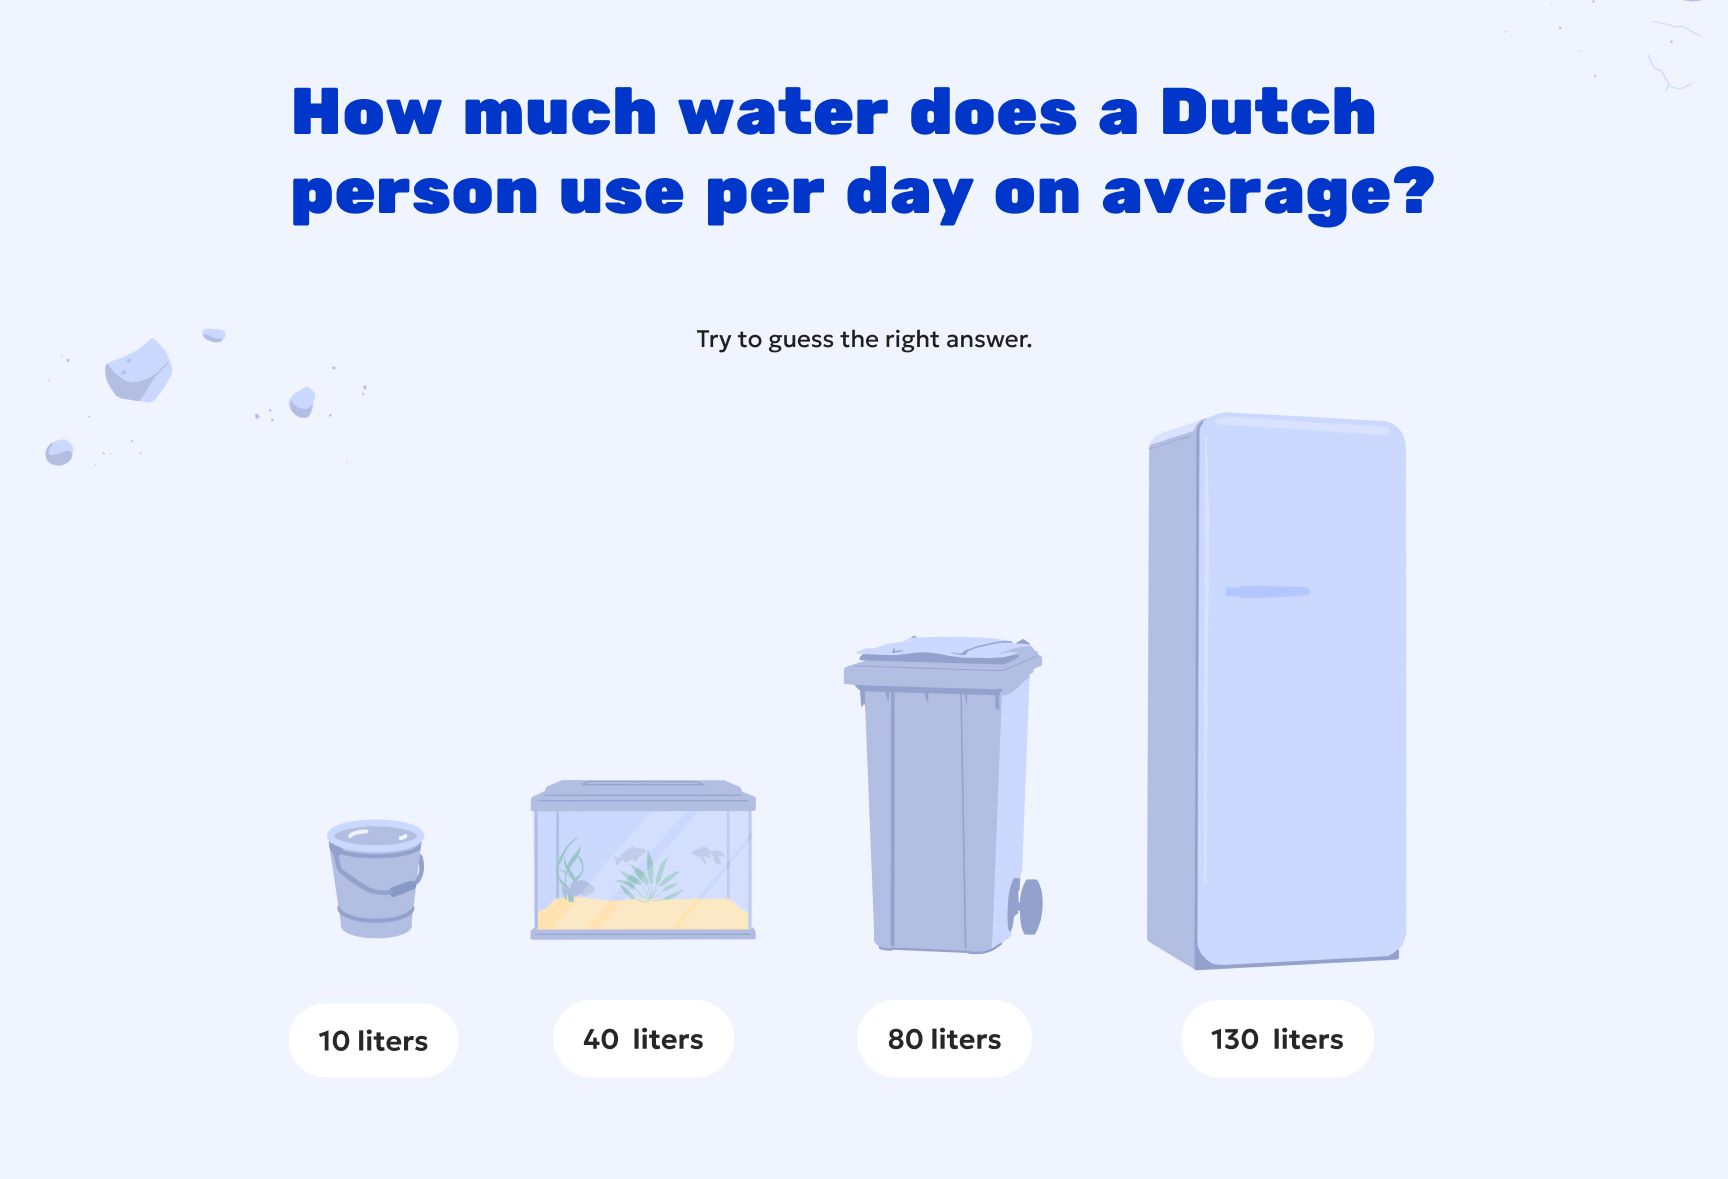
This project is an interactive one-page story about groundwater levels in the Netherlands. It’s based on real research and data, translated into a clear and engaging experience through information design.
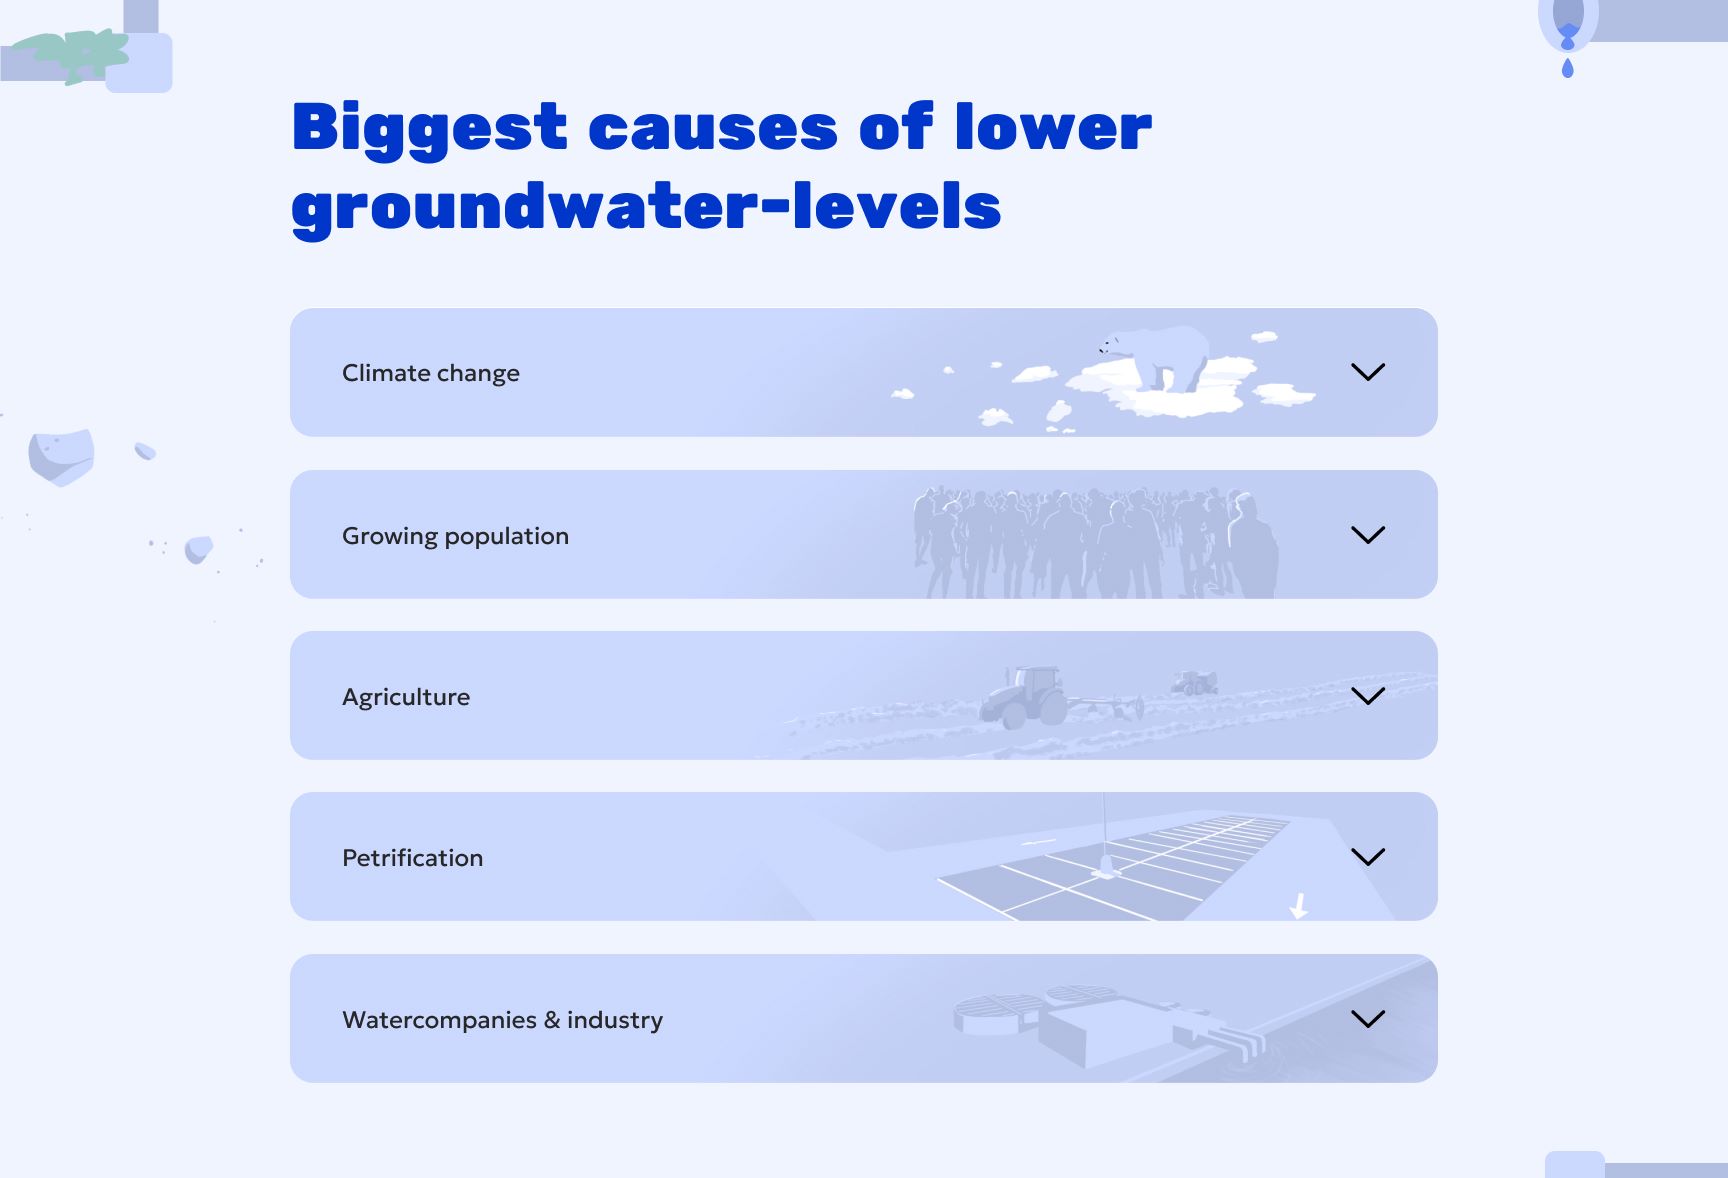
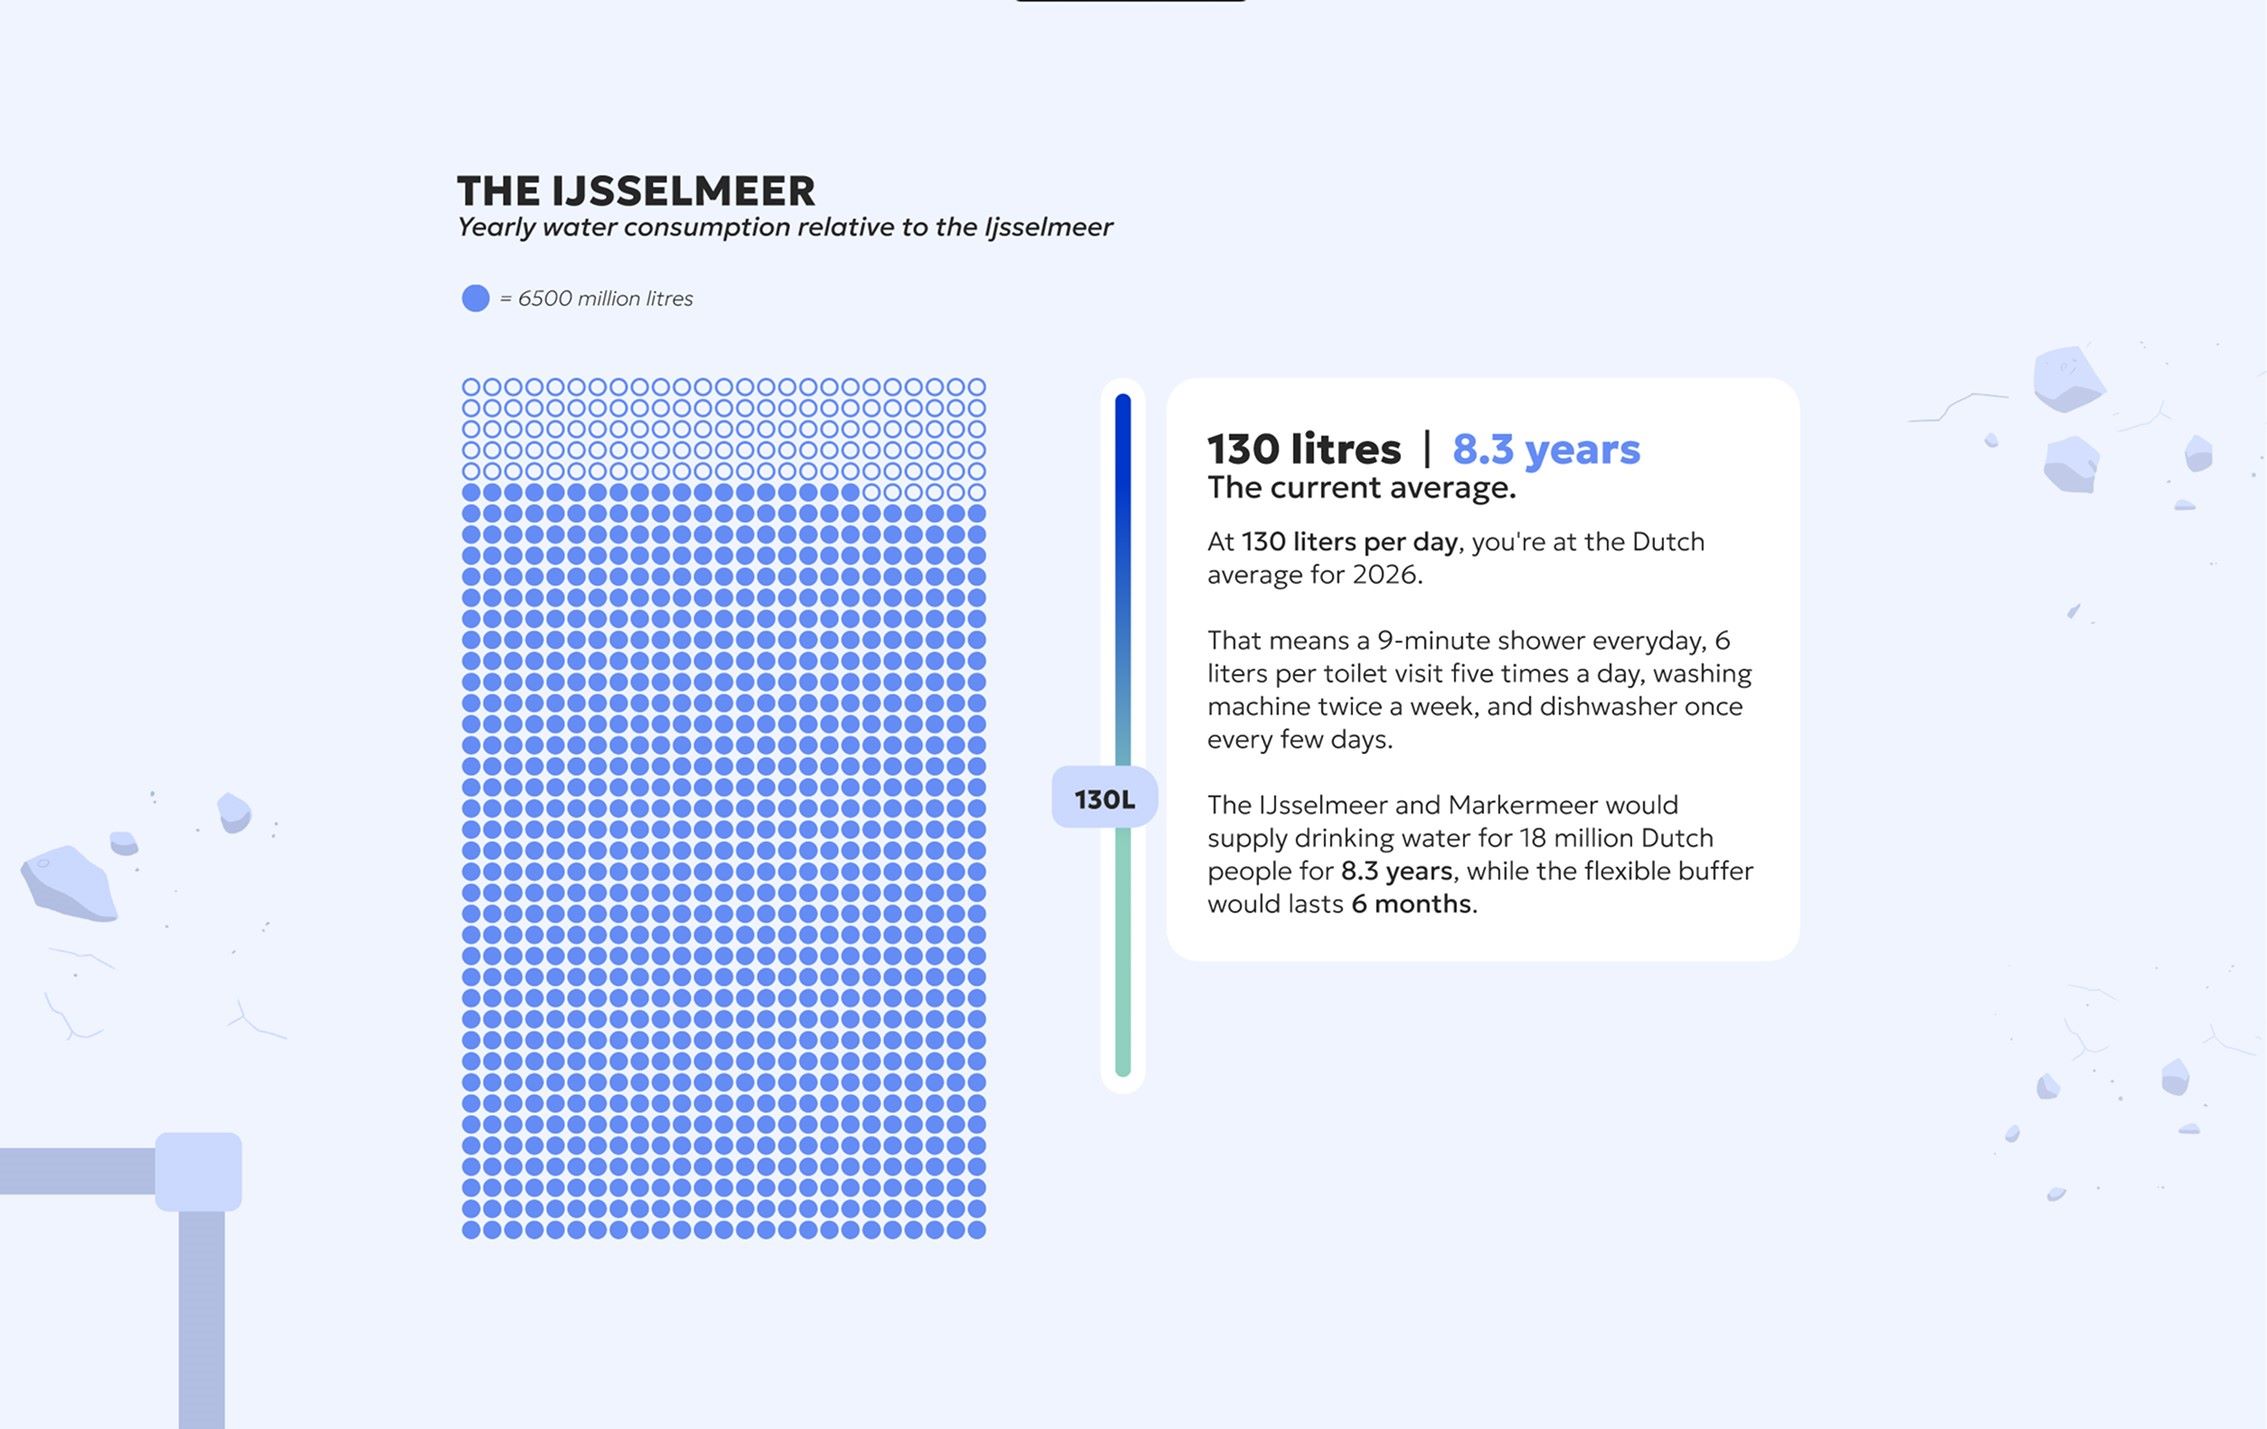
As users scroll, they’re guided through the topic step by step, with animations and interactive elements helping to explain how groundwater works, why levels are dropping, and what that means in everyday life. The focus is on making the data feel tangible and relevant, especially when it comes to the consequences for people living in the Netherlands.
The goal of the project is to turn a complex and often overlooked issue into something accessible, while raising awareness and encouraging more conscious water use.
Tools
- Figma
- Photoshop